Managing when you use power is now more important than how much.
All of us are used to looking at our home electric utility bill and our costs are based on the volume of electricity we used. Managing our costs means reducing the amount of energy we use. Easy! But, not so easy if you are a commercial or industrial customer.
Energy vs. Demand
Business owners also get charged based on their peak power usage, a completely different challenge, and it’s getting harder every year. Utilities have different names for these time-based charges like demand charges, coincident peak charges, and ratchet charges. What most businesses don’t realize is that these charges can represent over 70% of their total annual bill. And most business owners are surprised that even after solar and energy efficiency measures, these charges don't drop nearly as much as they expected. To understand why, you have to understand utility billing structures.
Components of a commercial utility bill
Electric utility bills typically break down into three main charge types:
- Baseline (Fixed) charges – non-volumetric, typically flat charges, often assessed per meter or account.
- Energy charges - for the volume of energy you use, priced in dollar per kilowatt-hour ($/kWh) based on the amount of electricity consumed over a period of time.
- Demand charges – based on the maximum amount of power (kW) consumed during any 15-min period (called an interval), priced in dollar per kilowatts ($/kW). Think of your peak demand as your high water mark each month.

Calculating Energy Charges
Here’s a quick example from a typical 50,000 sqft commercial retail building.
This building has 15 roof-top packaged HVAC units, each with a nameplate power rating of around 10 kilowatts (kW). And each of these units run, on average, 5 hours per day. The energy (volume) consumed in one month would be power x time:
15 HVAC units x 10 kW x 5 hrs/day x 30 days = 22,500 kWh energy
The utility charges $0.12/kWh for energy (we will ignore time-of-use rates for now). The cost to run those 15 HVAC RTUs for an average of 5 hours per day for a month would be:
22,500 kWh x $0.12 / kWh = $2,700
Calculating Demand Charges
Demand charges are very different – you are billed for the highest 15-minute usage, each month.
Let’s assume that all the other (non-HVAC) equipment combined would draw 50 kW of power if it all turned on at the same time. Now imagine that all 15 HVAC units turned on as well – that would be another 150 kW of power. The total power draw of the entire building would be 200 kW.
(15 HVAC Units x 10 kW) + 50 kW of Other Loads = 200 kW demand
For this customer, the utility demand charges were $15/kW. So, the demand charges would be:
200kW * $15/kW = $3,000
Customer’s Total Bill
| Item |
Usage |
Cost |
% of Total |
| Fixed |
n/a |
$300 |
5% |
| Energy |
22,500 kWh |
$2,700 |
45% |
| Demand |
200 kW |
$3,000 |
50% |
| Total |
|
$6,000 |
100% |
Even if this retail building owner could reduce their energy usage by 90%, they would only reduce their total bill by 40%. Buildings need sophisticated software to manage and coordinate when equipment runs to effectively manage demand charges.
Why do Utilities have Demand Charges?
Utilities are expected (and required) to deliver "5-9's" of reliability. That means 99.999% of the time, when you turn on a light-switch, the light comes on! And, to achieve this level of performance requires the utility to be able to meet the peak load on the peak day of the year. Think summer heat-wave, or winter polar-vortex. The utility must have sufficient generation to meet the power needs of all electric customers at any moment. And, it must have the ability to transmit that much power. An analogy is designing our freeways to be able to handle the worst hour of traffic during the year without anyone having to slow down due to the number of cars on the road. As you can imagine, this requires over-building generation, transmission and distribution resources to be able to meet that one 15-min worst-case scenario.
Demand charges allow utilities to equitably recover the costs associated with supplying and maintaining enough generation (power plants) and distribution capacity (poles & wires). Electric customers with the greater power requirements need a 'bigger pipe' and pay more to have access to that pipe. It’s not uncommon for commercial customers to have demand charges that comprise over 50% of their total electric bill.
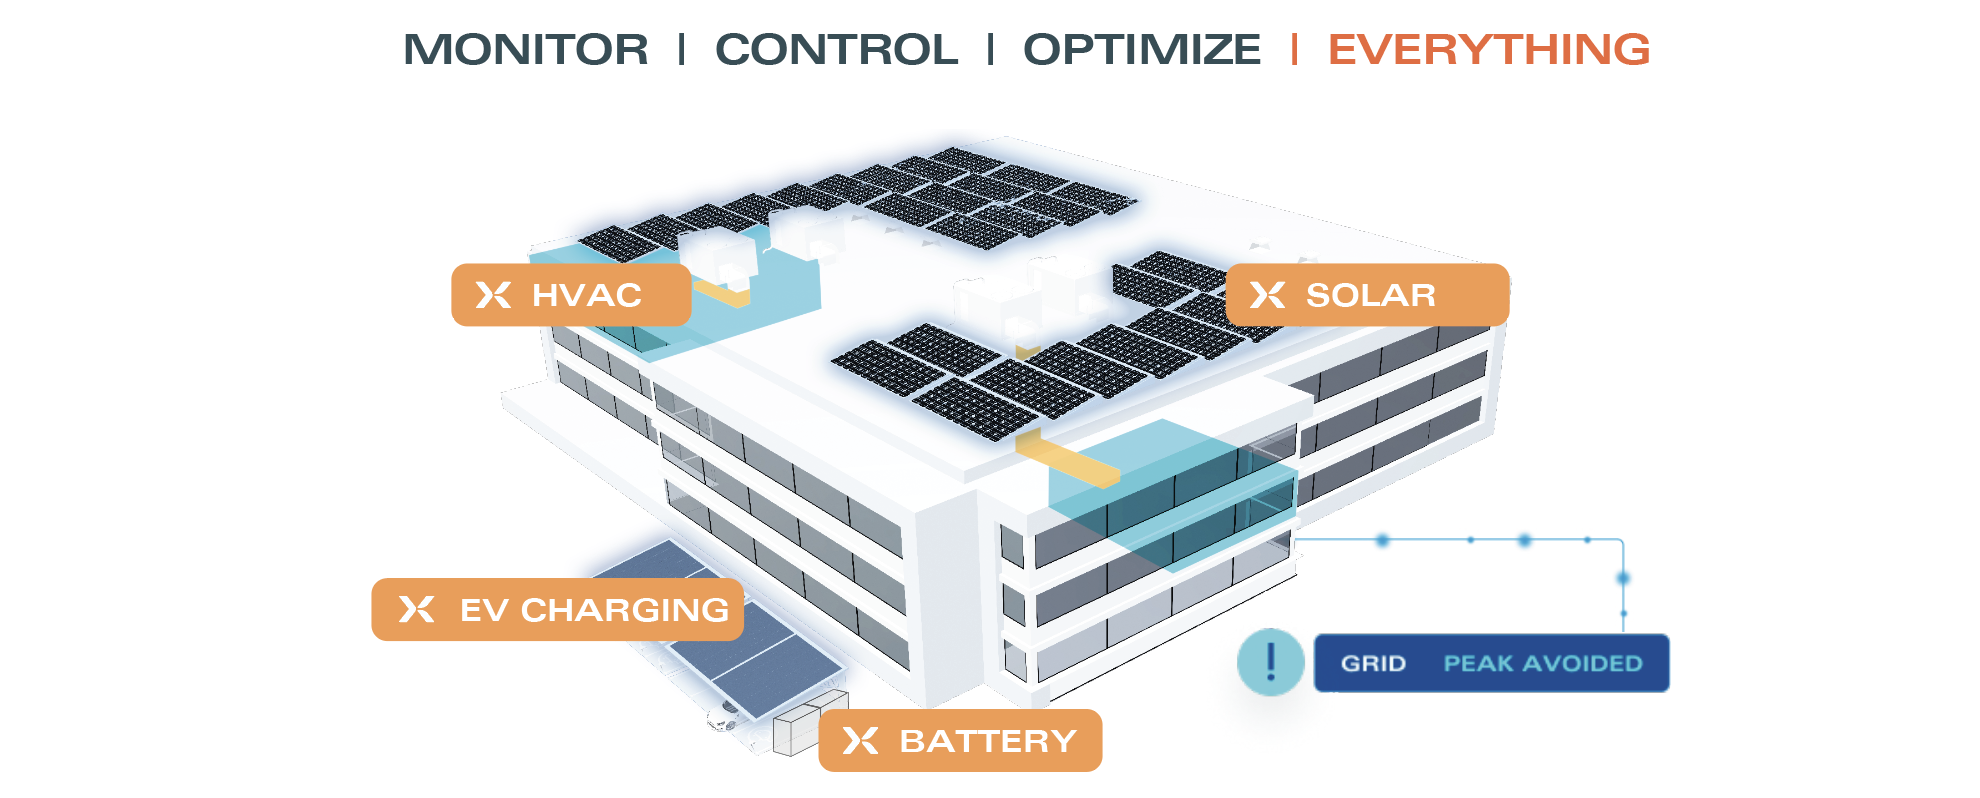
Similar to energy charges, demand charges effectively incentivize customers to alter their consumption behaviors. However, demand charges are much more challenging to manage because they require real-time control of all the major electric loads in the building. You have to coordinate when equipment runs to minimize the peak load. This is not something that can be effectively managed manually or with traditional building control technology that relies on rule-based controls or schedules. It requires sophisticated software that is aware of the entire building’s energy use every minute, so it can predict or react to minute-to-minute changes and avoid peak loads.
Types of Demand Charges
- Max/Non-coincidental - charged based on a customer’s highest kW demand within a billing period, irrespective of when the utility’s peak is set.
- Time-of-Use – charged based on the customer’s highest kW demand within a specific time period. TOU demand charges are generally aligned to be coincident with the utility’s system-wide peak. For example, the “on-peak” TOU demand period in California is 4 pm – 9 pm.
- Flat – $/kW demand charges that are assessed based on a single kW demand reading.
- Tiered – $/kW demand charge that differs depending on whether a customer is above or below a specified demand threshold. It is analogous to overage charges.
- Daily – $/kW/day demand charges that are measured and billed each day within a billing period.
Demand charges have been part of the commercial electric bill for decades. However, over the last ten years, demand charges have been rising even faster than volumetric charges, and continued increases are expected to continue for years to come.
Ratchets
Many demand charges have a "ratchet" that applies when determining the demand figure that will be used in billing. A demand ratchet can be viewed as a minimum level billed; a customer’s actual observed demand reading could be significantly lower than what they are billed for. Some demand ratchets can be quite complex, involving different equations and conditional calculations. The two most common ratchet types seen are 1) a fixed kW minimum and 2) a minimum derived from applying a percentage to a reference variable.
An example of a complex demand ratchet can be found on the “Orange and Rockland Utilities – New York” SC 3 rate, which includes both demand ratchet types.
The billing demand shall be defined as the highest 15-minute integrated kW demand determined during the month by the use of a suitable demand indicator. The minimum billing demand shall be 100 kW.
The billing demand for the billing months of October through May inclusive shall not be less than 70% of the highest metered demand for the preceding billing months of June through September inclusive.”
The tariff excerpt above states that customers under this rate will never be billed less than 100 kW. In addition, during the winter months, the billing demand will not be less than 70% of the highest demand occurred during the summer months. For example, if a customer’s max demand during the month of November is 150 kW but their demand in August was 400 kW, their November bill will include 280 kW (400 kW x 0.70) as the billing demand.
The energy analysts at Elexity are continually coming across new demand ratchet structures. It seems utilities are constantly getting more creative in designing new structures. We can help any customer analyze their usage and rate schedule, including these complex demand ratchet-type tariffs.
The Evolution of Demand Charges
Our utility rates team tracks different demand charge structures throughout the globe and has seen a number of changes over the years. One general trend that will come as no surprise to anyone is that similar to $/kWh energy charges, $/kW demand charges are continuing to escalate. How demand charge increases are implemented varies widely. For example, in California utilities have lobbied in their recent (GRC) General Rate Case filing to move towards Time-of-Use (TOU) demand charges, and away from Max or Non-coincident demand charges. This is an acknowledgment that the utilities are most motivated to reduce their system-wide peak, which occurs during the “on-peak” period, currently defined as 4 pm – 9 pm. By levying higher “on-peak” demand charges customers are incentivized to shift their loads outside that time window. As mentioned earlier, we expect to see new experimental demand charge structures and ratchets get introduced. Examples include daily demand charge rates, or possibly a push by utilities to implement demand charges on residential customers.
Solar and Demand Charges
Utilities are well aware of the fact that solar PV systems do not reduce demand charges as efficiently as they do energy charges. Solar advocates have long accused utilities of shifting more of their cost recovery onto demand charges, as a covert way to weaken the value proposition of rooftop solar. Whether that was their intention or not, higher demand charges in exchange for lower energy charges, does reduce the savings that solar can deliver. On the flip side, higher demand charges create an opportunity for load-management software and energy storage. Peak-shaving and demand charge management is generally the primary value stream or bill savings opportunity for these projects. Sophisticated energy efficiency, solar, and energy storage project developers are aware of these dynamics and strategically optimize their system sizes to reduce demand charges and the overall electric bill.